Textile
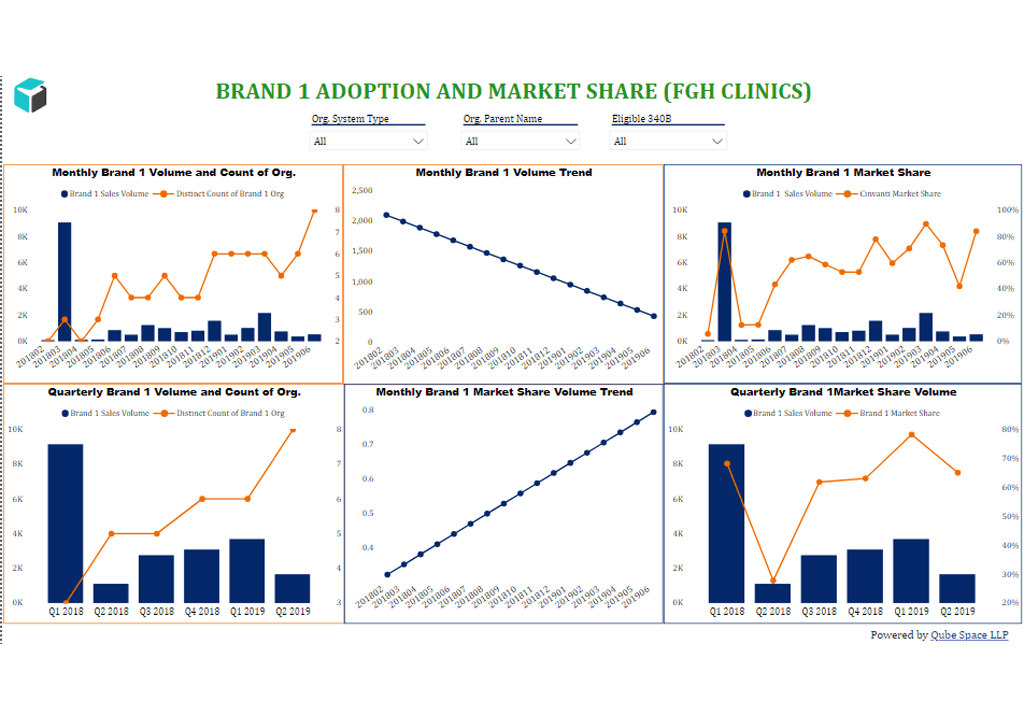
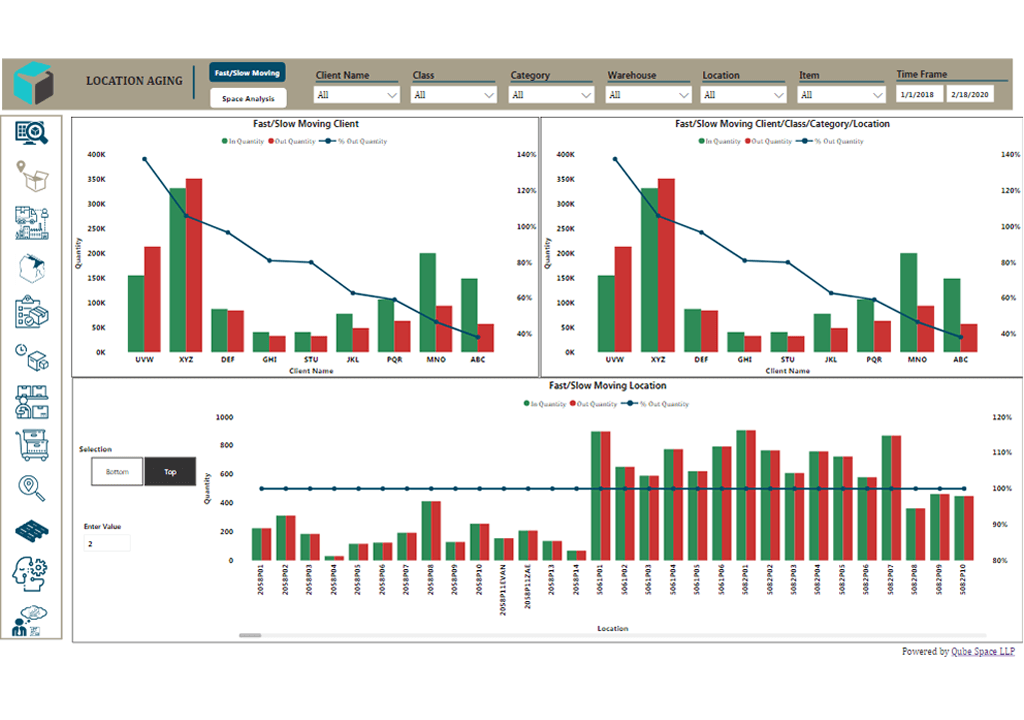
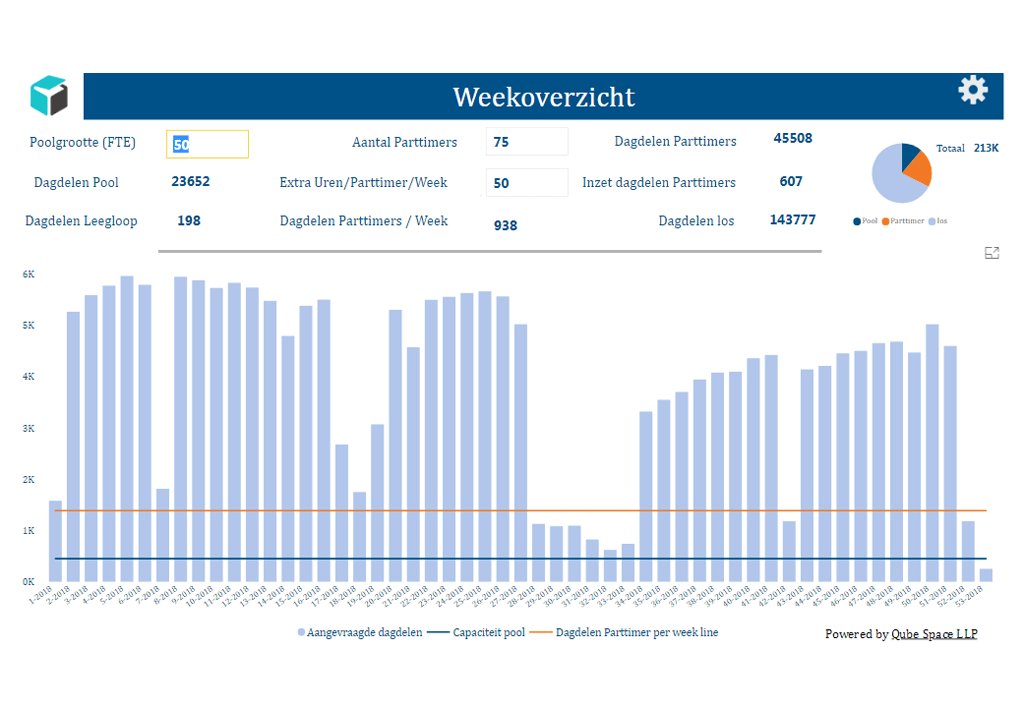
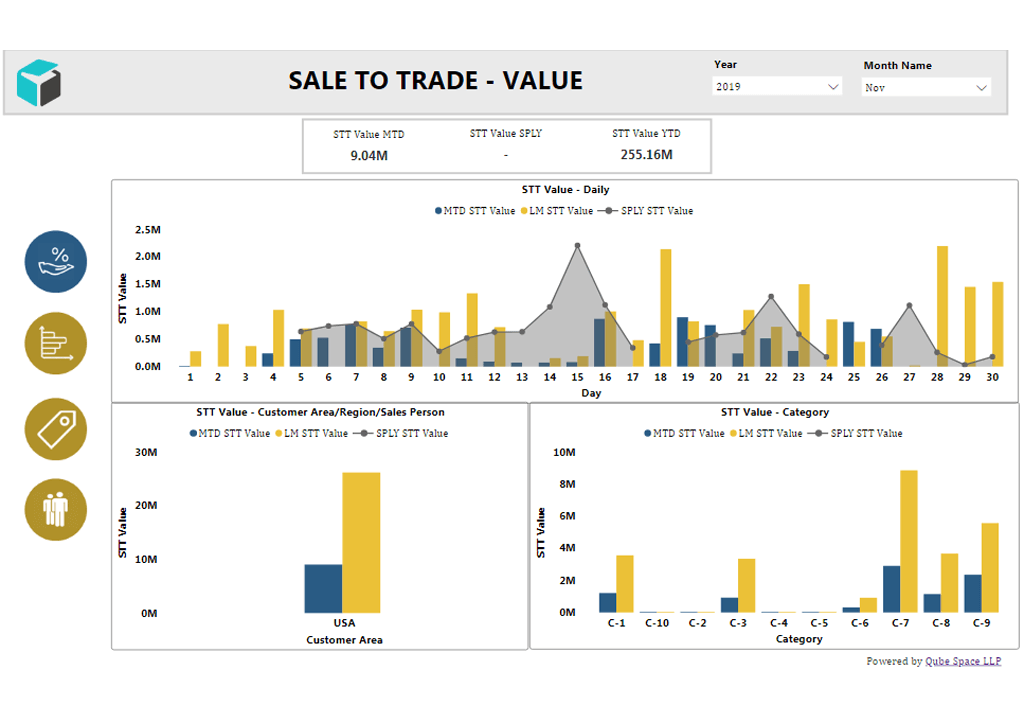
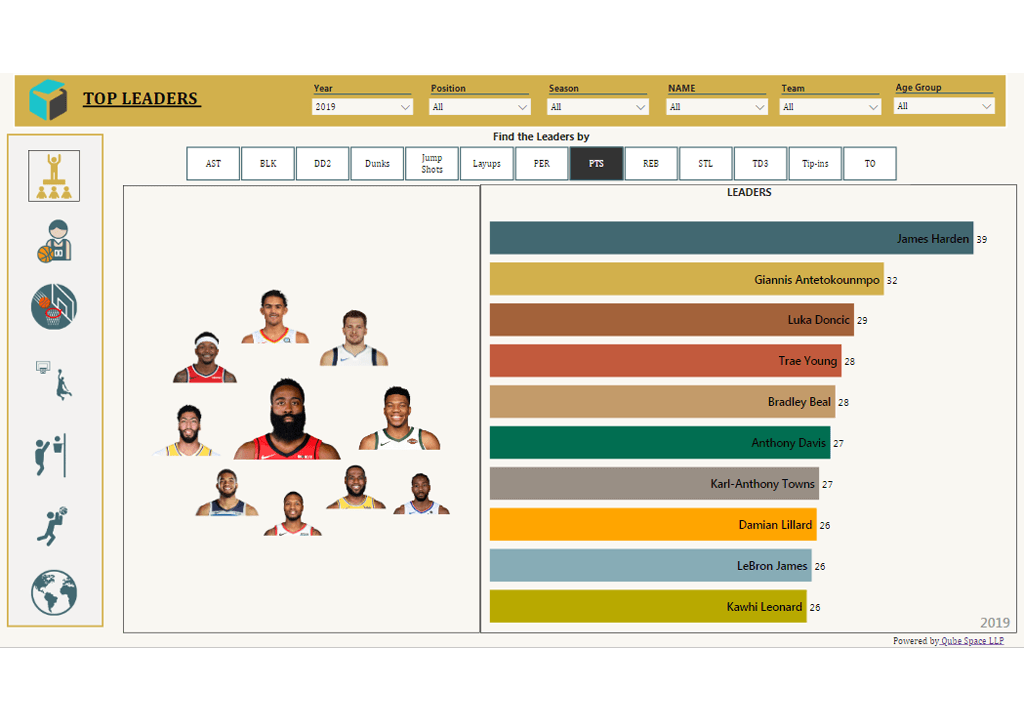
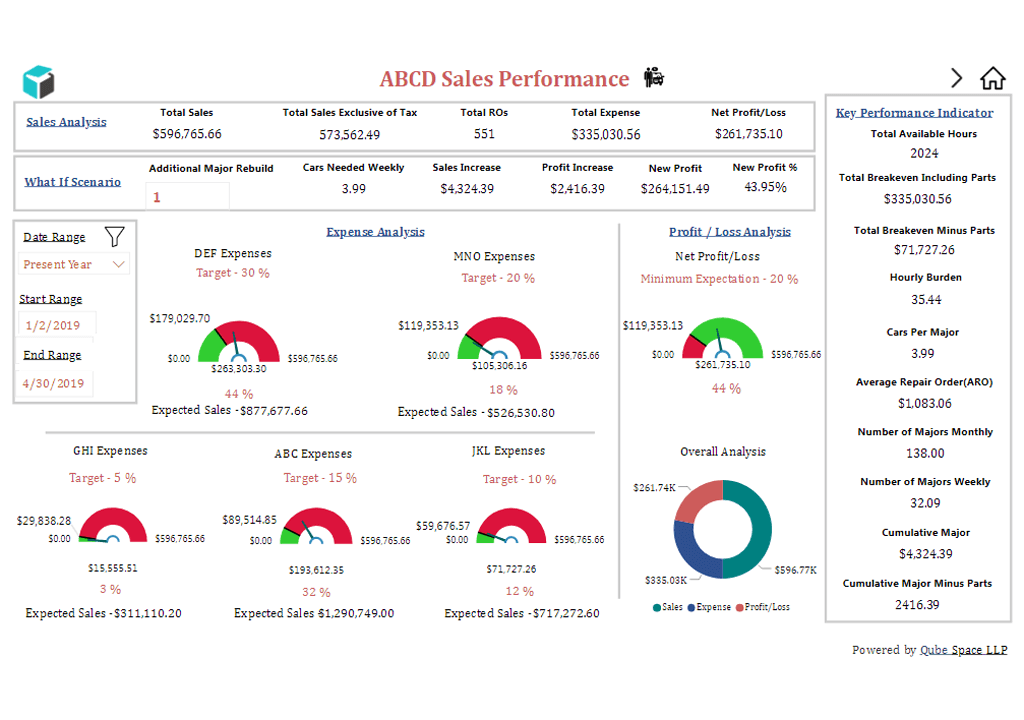
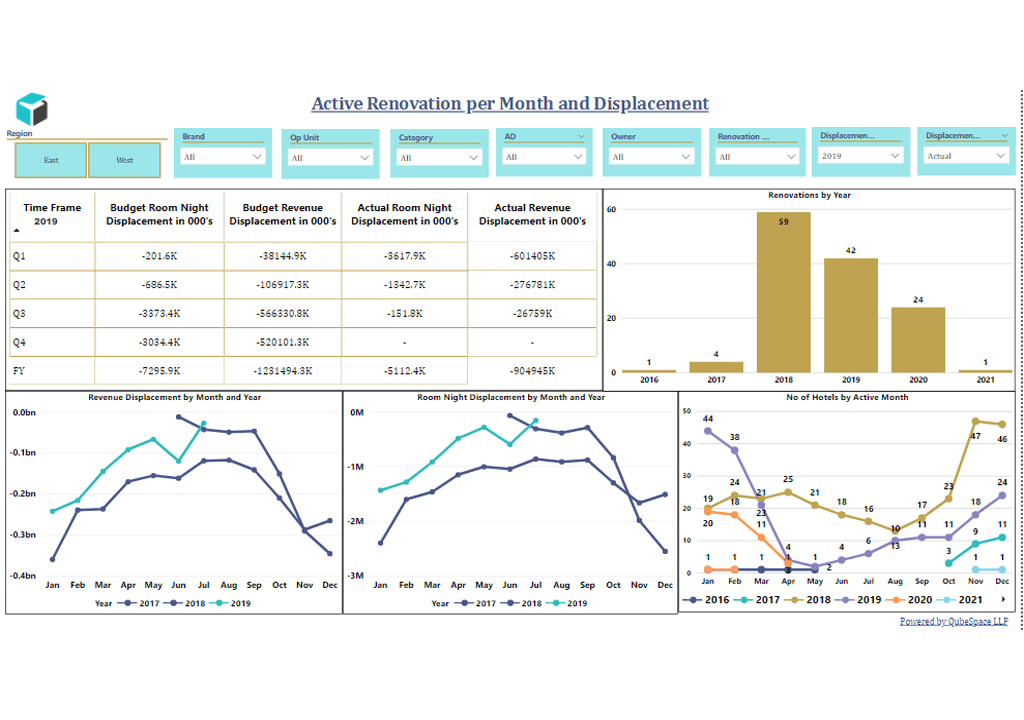
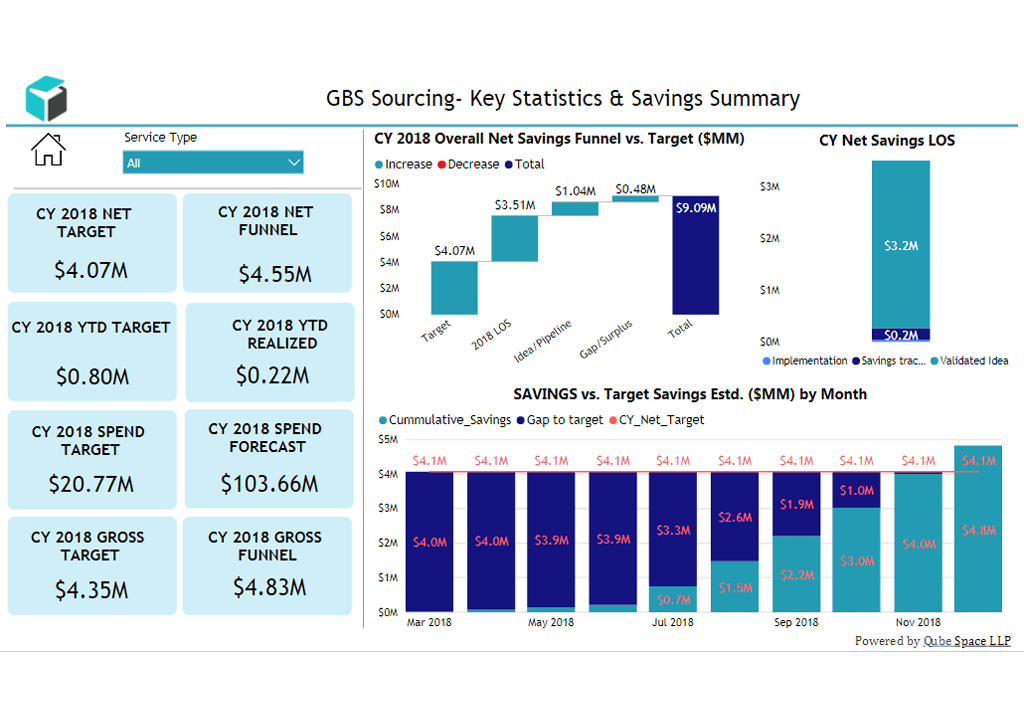
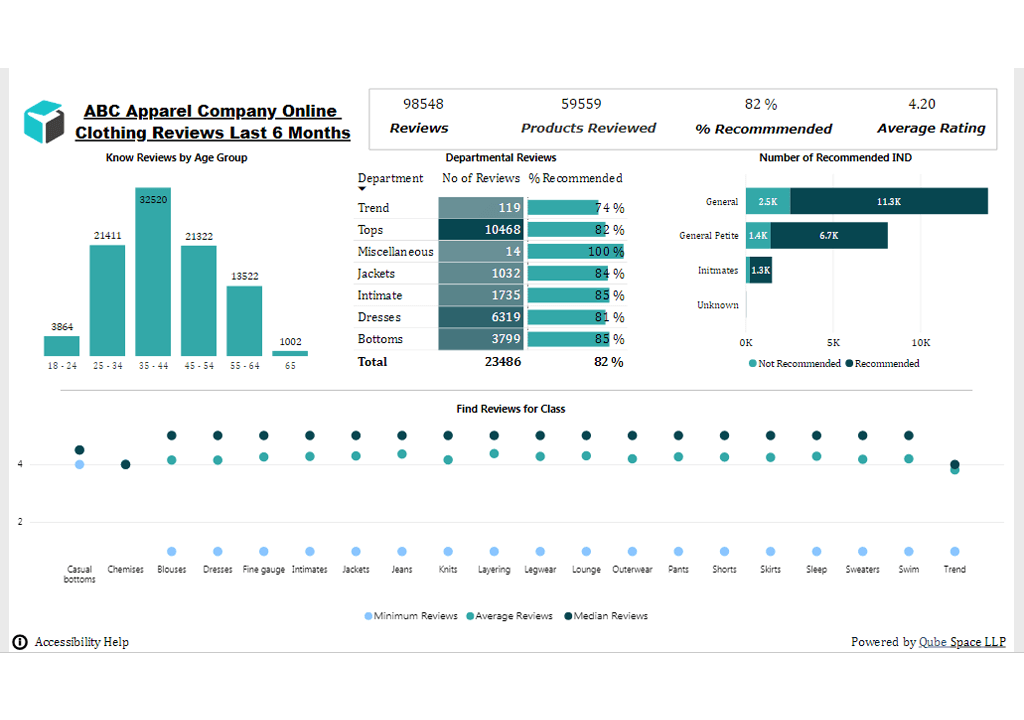
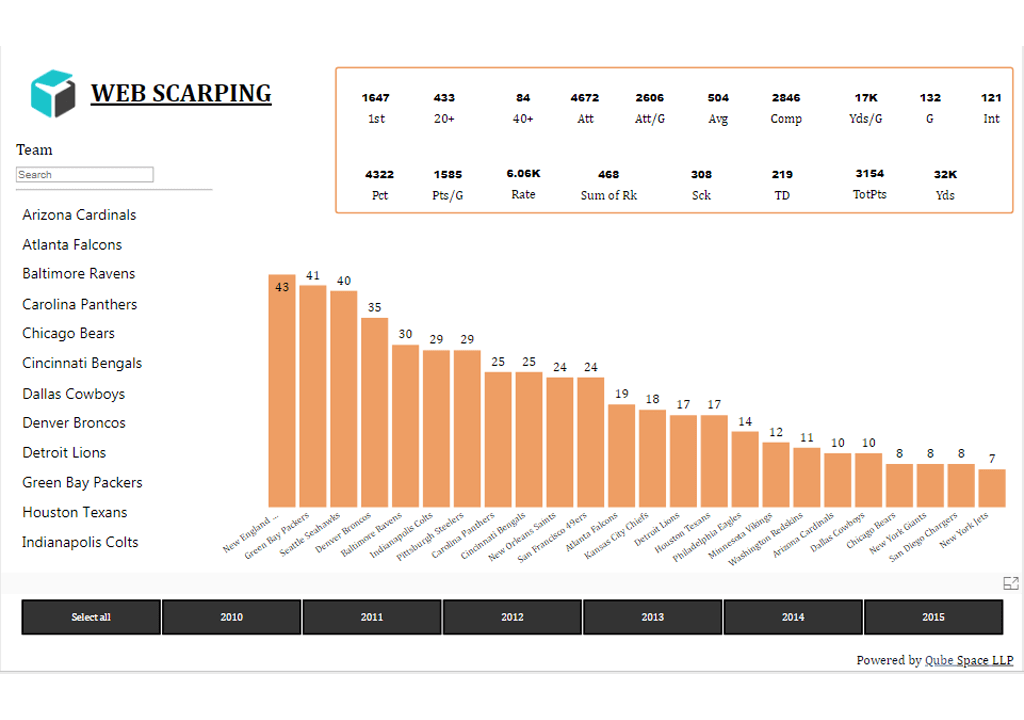
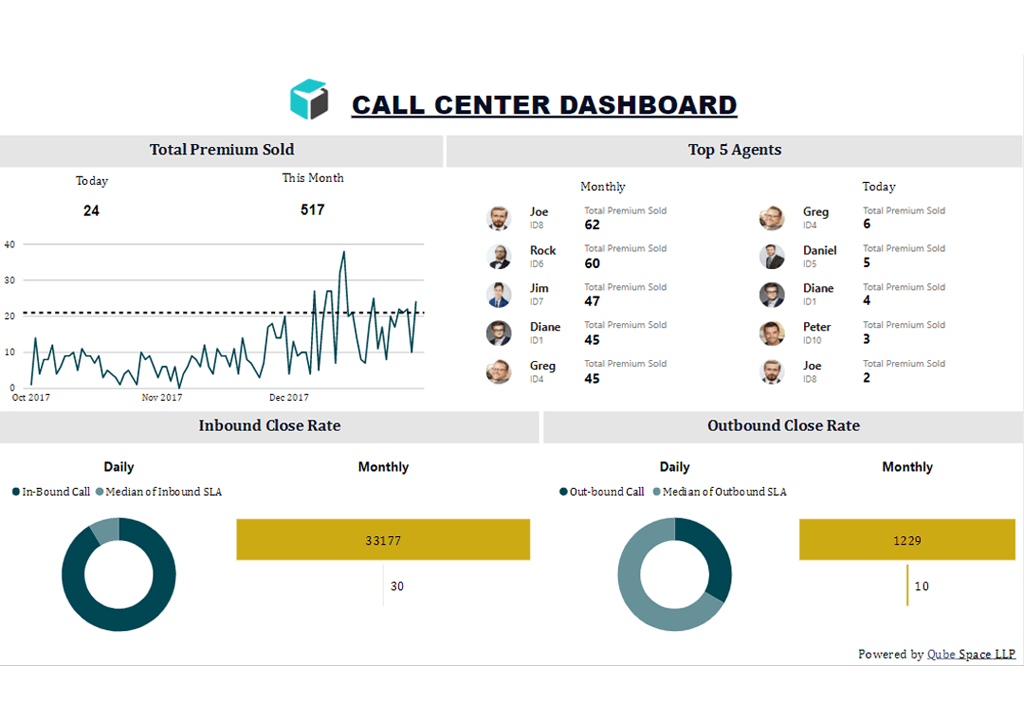
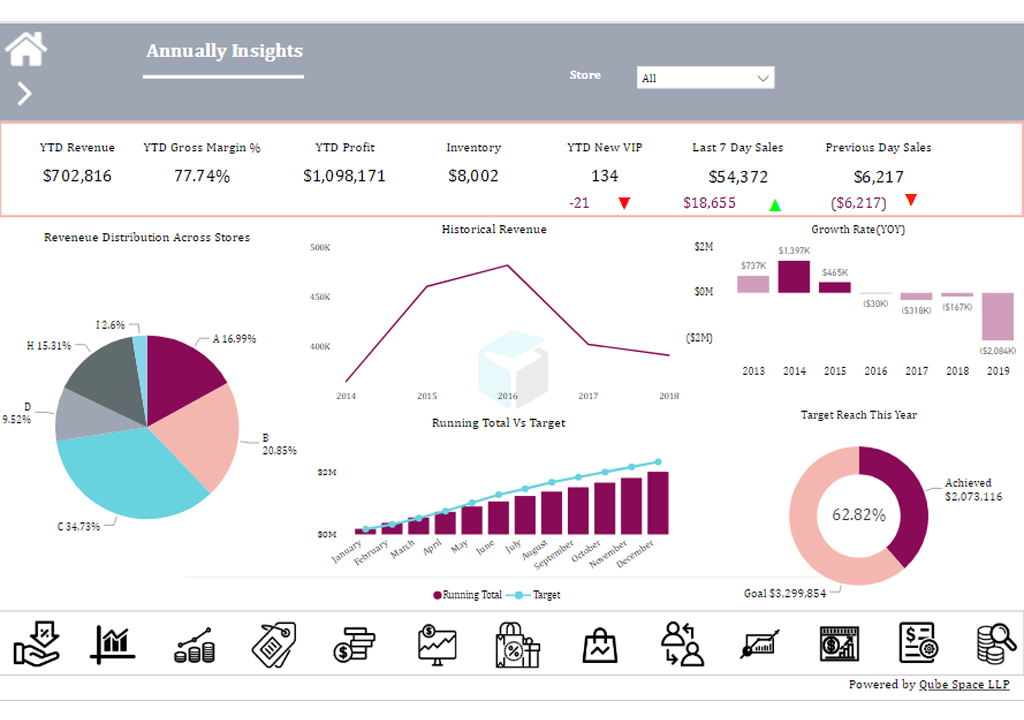
Textile Sales Dashboard describes about Revenue, P/L, % of growth over each year, sales across 7 stores, 5 location, fast- and slow-moving products over year, month and quarter. Gives insight into which product type is sold the most in each day, hour, week, month and year. This Dashboard also provide Customers Analysis, providing how many new customers are buying product, how many Customer are repeated buying, how customers are active by referral. Textile report shows the expense spend for labor, market and other general expense.
